
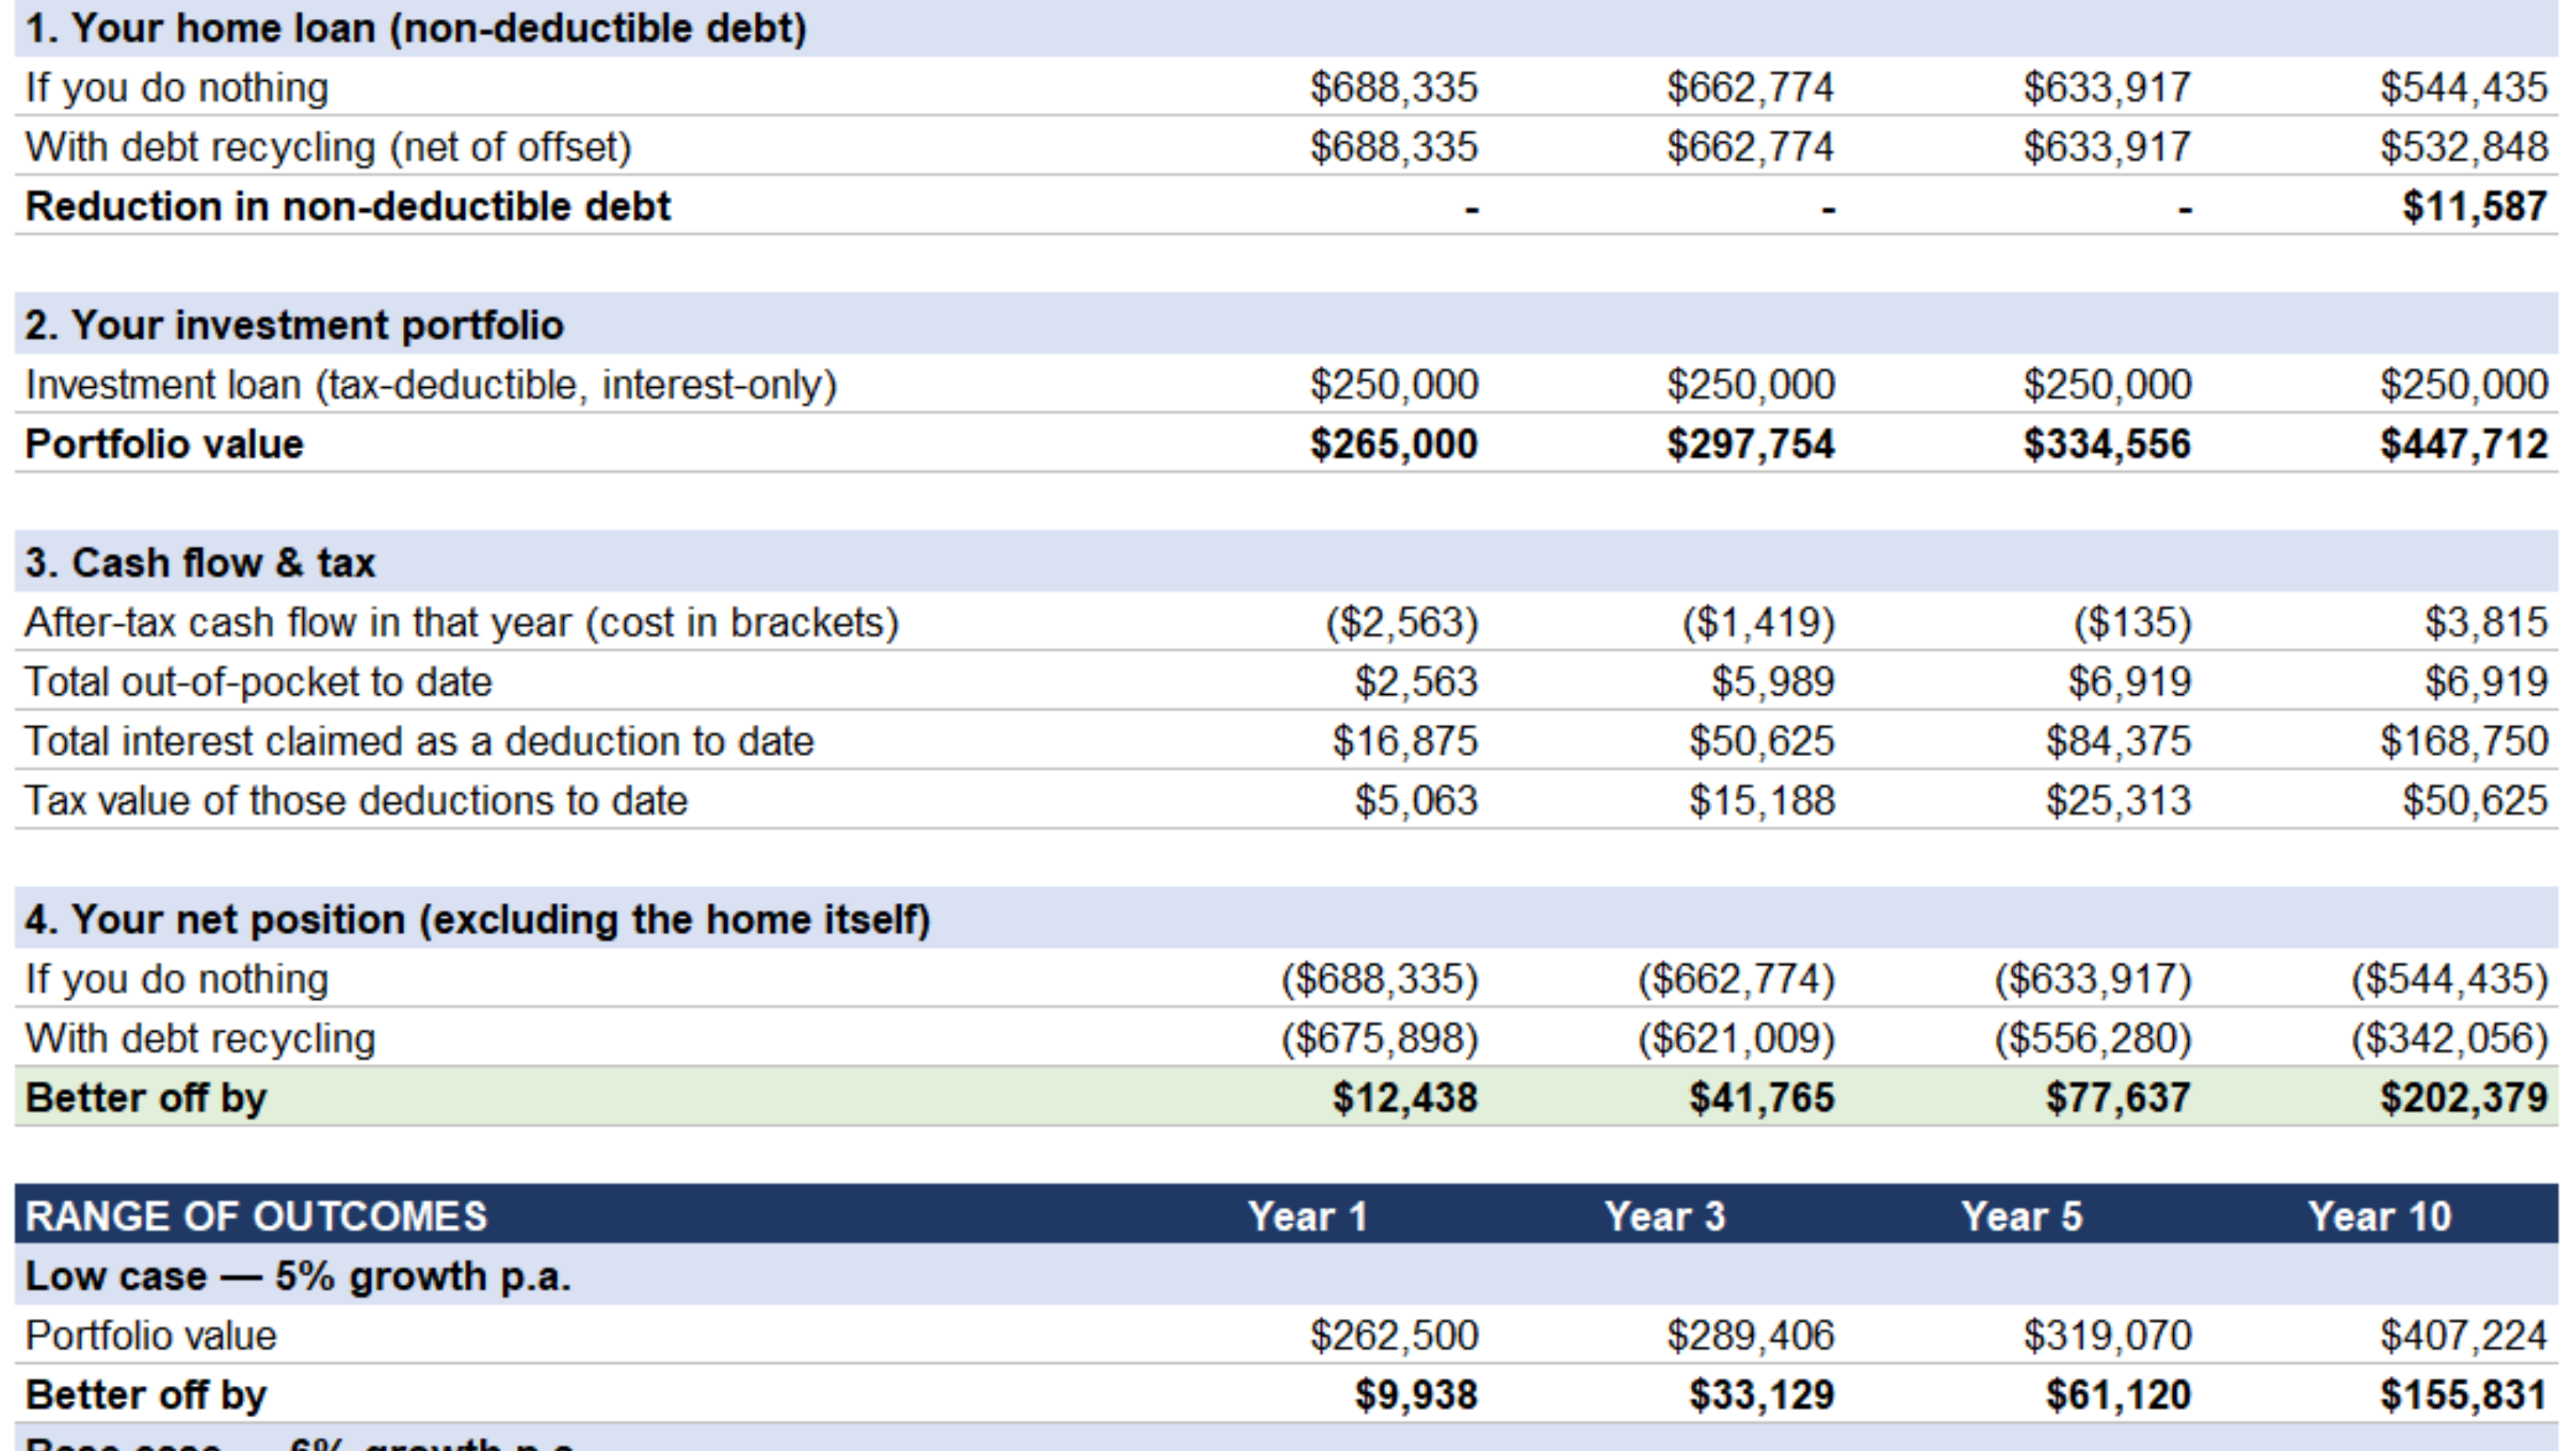
In this illustrative scenario, a homeowner who uses debt recycling finishes ten years around $202,000 better off than one who simply keeps paying down their home loan — for a total out-of-pocket cost of under $7,000.
Most Australian homeowners carry one large debt that does nothing for them at tax time: the mortgage on the home they live in. Every dollar of interest is paid with after-tax income. Debt recycling is a strategy that aims to gradually turn some of that “bad” debt into tax-deductible “good” debt, while building an investment portfolio alongside the home.
Below, we walk through a real-world style projection, year by year, including what it costs, what it could return and what could go wrong.
Short on time? Watch the breakdown
The scenario
Our example homeowner has a home loan of roughly $688,000 and enough equity to set up a separate investment loan. Here are the assumptions behind the projection:
| Assumption | Value |
|---|---|
| Investment loan drawn | $250,000, interest-only |
| Investment loan rate | 6.75% p.a. |
| Portfolio growth (base case) | 6% p.a. |
| Portfolio income yield | 4% p.a. |
| Marginal tax rate | 30% |
The homeowner keeps making their normal home loan repayments either way. The only difference between the two paths is whether they also set up the investment loan and portfolio.
Debt recycling in plain English
Debt recycling uses the equity in your home to borrow for income-producing investments, then uses what those investments earn to pay down your home loan faster.
- A separate loan split is set up against your home and used only to buy investments, such as shares or managed funds.
- Because that loan funds investments, its interest is generally tax-deductible.
- Investment income and tax refunds are directed back into your non-deductible home loan.
- Over time, your home loan shrinks while your investment portfolio grows.
Keeping the investment loan completely separate from your home loan matters. Mixing the two can make the interest hard to claim.
The results: $202,379 better off after 10 years
By Year 10, the homeowner using debt recycling is $202,379 better off in net position than the one who did nothing. Net position here means investments minus all debts, excluding the value of the home itself.
| Year 1 | Year 3 | Year 5 | Year 10 | |
|---|---|---|---|---|
| Home loan, if you do nothing | $688,335 | $662,774 | $633,917 | $544,435 |
| Home loan, with debt recycling | $688,335 | $662,774 | $633,917 | $532,848 |
| Investment portfolio value | $265,000 | $297,754 | $334,556 | $447,712 |
| Net position, if you do nothing | –$688,335 | –$662,774 | –$633,917 | –$544,435 |
| Net position, with debt recycling | –$675,898 | –$621,009 | –$556,280 | –$342,056 |
| Better off by | $12,438 | $41,765 | $77,637 | $202,379 |
Two things drive the result. The $250,000 portfolio grows to an estimated $447,712, and once the strategy turns cash-flow positive, surplus income starts paying down the home loan, cutting non-deductible debt by $11,587 by Year 10.
What it costs along the way
The strategy costs money in the early years, totalling $6,919 out of pocket before it turns cash-flow positive.
| Year 1 | Year 3 | Year 5 | Year 10 | |
|---|---|---|---|---|
| After-tax cash flow that year | –$2,563 | –$1,419 | –$135 | +$3,815 |
| Total out-of-pocket to date | $2,563 | $5,989 | $6,919 | $6,919 |
| Interest claimed as a deduction to date | $16,875 | $50,625 | $84,375 | $168,750 |
| Tax value of those deductions to date | $5,063 | $15,188 | $25,313 | $50,625 |
In Year 1, the shortfall is about $2,563, or roughly $49 a week. The gap narrows each year as the portfolio’s income grows. By Year 10, the investments are paying their own way with $3,815 to spare.
The tax deductions do a lot of the heavy lifting: over 10 years, $168,750 of interest is claimed, worth an estimated $50,625 back at a 30% marginal rate.
What if markets underperform?
Even with growth of 5% a year instead of 6%, the homeowner is still projected to be $155,831 better off after 10 years.
| Growth scenario | Portfolio value, Year 10 | Better off by, Year 5 | Better off by, Year 10 |
|---|---|---|---|
| Low case: 5% p.a. | $407,224 | $61,120 | $155,831 |
| Base case: 6% p.a. | $447,712 | $77,637 | $202,379 |
| High case: 7% p.a. | $491,788 | $94,770 | $252,954 |
Each 1% change in annual growth moves the 10-year outcome by roughly $45,000 to $50,000. That sensitivity cuts both ways, which is why the risks below matter.
The risks to weigh up
Debt recycling is a long-term gearing strategy, and borrowing to invest magnifies losses as well as gains.
- Markets can fall. The projection assumes steady growth. A downturn could leave the portfolio worth less than the $250,000 you owe on it.
- Interest rates can rise. Every 1% rise on a $250,000 loan adds about $2,500 a year in interest before tax.
- Your cash flow has to hold up. You need to cover the early shortfall even if your income changes.
- Tax rules and your tax rate can change. The benefit relies on the interest staying deductible at your marginal rate. The 2026–27 Federal Budget proposes negative gearing limits for residential property only, with shares unaffected, but its proposed CGT changes could affect what you keep when you sell.
- Structure matters. A poorly set-up loan split can put the deduction at risk.
- Selling has a cost. Capital gains tax applies when you sell, which this projection doesn’t account for.
Is debt recycling right for you?
Debt recycling tends to suit homeowners with solid equity, stable income, a long time horizon and the stomach for market ups and downs.
It is usually less suitable if your income is uncertain, you plan to sell your home soon, or a market fall would cause you real stress.
The lending structure is where a mortgage broker comes in. At hfinance, we can help you understand how much equity you could access, compare lenders and set up a clean loan split. You can also browse our other client case studies. We work alongside your accountant and financial adviser, who can tell you whether the strategy suits your goals and tax position.
Thinking about debt recycling? Book a chat with the hfinance team to see what your numbers could look like.
Important information
This case study is an illustrative projection only, based on assumed rates of growth, income, interest and tax. It is not a forecast, and actual results will differ. It is general information and does not take into account your objectives, financial situation or needs. It is not financial, tax or investment advice. Before acting, speak with a licensed financial adviser and a registered tax agent about your circumstances. Past performance is not a reliable indicator of future performance.